Earlier this week, we asked you what statistics you would like to see. Since then, we have collected data on some of the most popular requests and designed some fancy graphics for them. There are a few things to note:
- This data does not include the recent PTB.
- Data involving rank was collected shortly before a rank reset (April 1st to April 7th).
- These are very general statistics, so use caution before drawing any conclusions.
Average Party Size
This is the overall average, between all ranks and platforms, of how many other Survivors players are queuing up with. More than half of the total Survivors are playing solo, while only 3-6% are playing in a full Survive With Friends group. This is based on the group size out of the total number of matches.

Party Size Survival Rate
This is the average chance of Survival per Survivor depending on the size of the Survive With Friends group they are playing in. This is an average between all ranks on all platforms.

Survival Rate by Rank
This graph shows the average rate of survival per Survivor at any given rank, per platform. Please note: The data collected is using your rank after the match, so players who depipped from rank 1 down to rank 2 would appear as rank 2 for our purposes. This is likely the reason why you'll notice a large gap between the survival rate of rank 1 and rank 2: Players who survived were more likely to pip and maintain their rank, while those who died were more likely to depip and lose their rank.
This data was also collected between April 1st and April 7th, after the pipping thresholds were originally changed but before they were later tweaked to be more forgiving for Survivors. Because of that, the statistics at this rank are from a small sample size consisting solely of the best players that could maintain rank 1 with the strict pipping conditions.
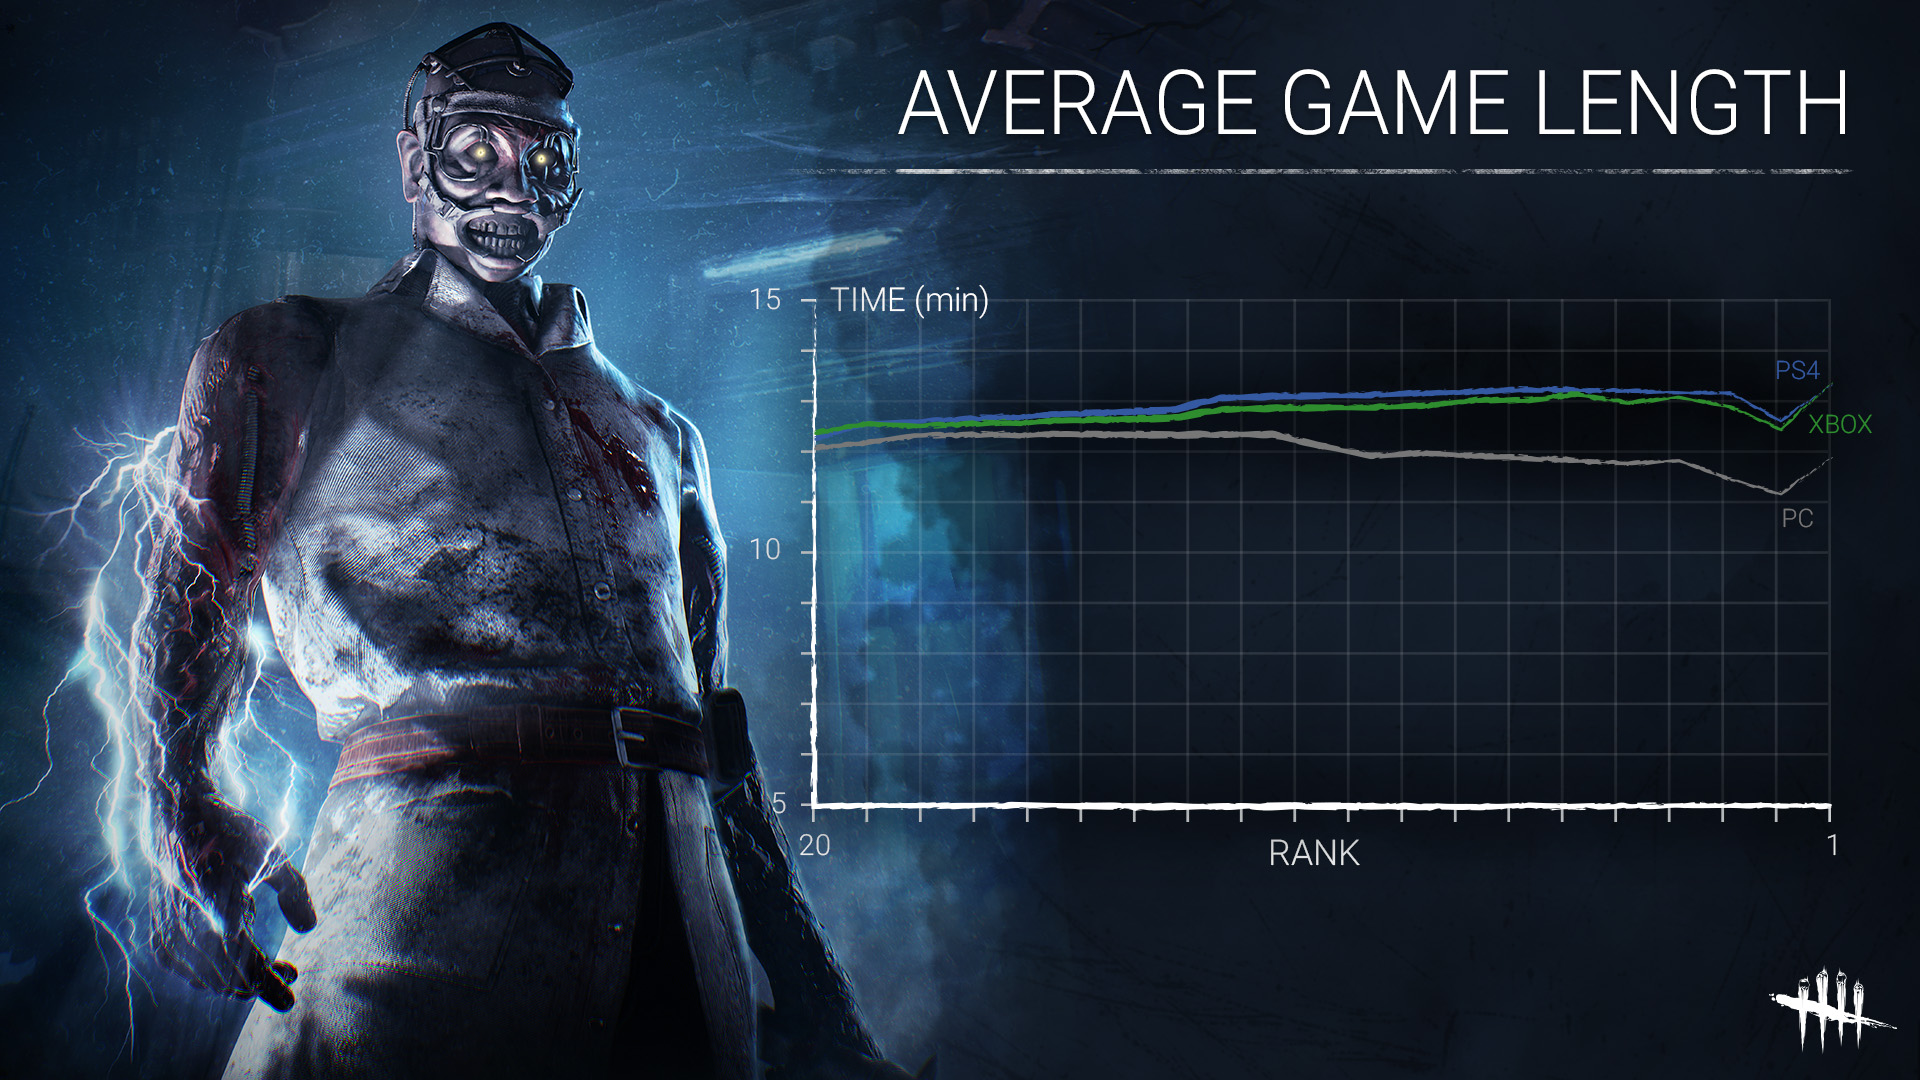
Average Game Length
This graph shows the average game length at any given rank for each platform. This is the time from the start of the match until the final Survivor either escapes or is sacrificed.

Most Popular Killer by Rank
This chart shows which Killer is the most popular depending on rank, per platform. For example, on PC from rank 1-4, nurse is the most popular Killer, while Hillbilly tends to be more popular from rank 5-12. The highest overall usage for any Killer at a given rank is the Nurse at rank 1, coming in at 22.39%.

Highest and Lowest Kill Rates
This chart shows the deadliest (yellow) and least deadly (red) Killers per platform. These stats are an average for all ranks. Since there are four Survivors, a 50% kill rate equates to two Survivors escaping and two Survivors dying.

Most Used Perks (Survivor)
This chart shows the most popular Survivor perks based on rank ranges between all platforms. We decided not to display ranks 13-20 as they tend to be more random (newer, lower ranked players tend to use whichever perks they have rather than picking what they want specifically). The numbers displayed are the percentage that perk is used of all perks used at that rank.

Most Used Perks (Killer)
This chart shows the most popular Killer perks based on rank ranges between all platforms. Like the Survivor perks above, we decided not to show ranks 13-20. The number displayed are a percentage of the total perks used at that rank range.
Is there something that confuses you? Maybe you'd like to know a more precise number on one of these stats? I'll be doing a live Q&A in the official Dead by Daylight Discord server tomorrow at 2PM EST.
If you are not in the Official Discord server, you can join here: https://discord.gg/549m9NT
The Q&A will take place in the #game-discussion channel.