Hey Arrendis,
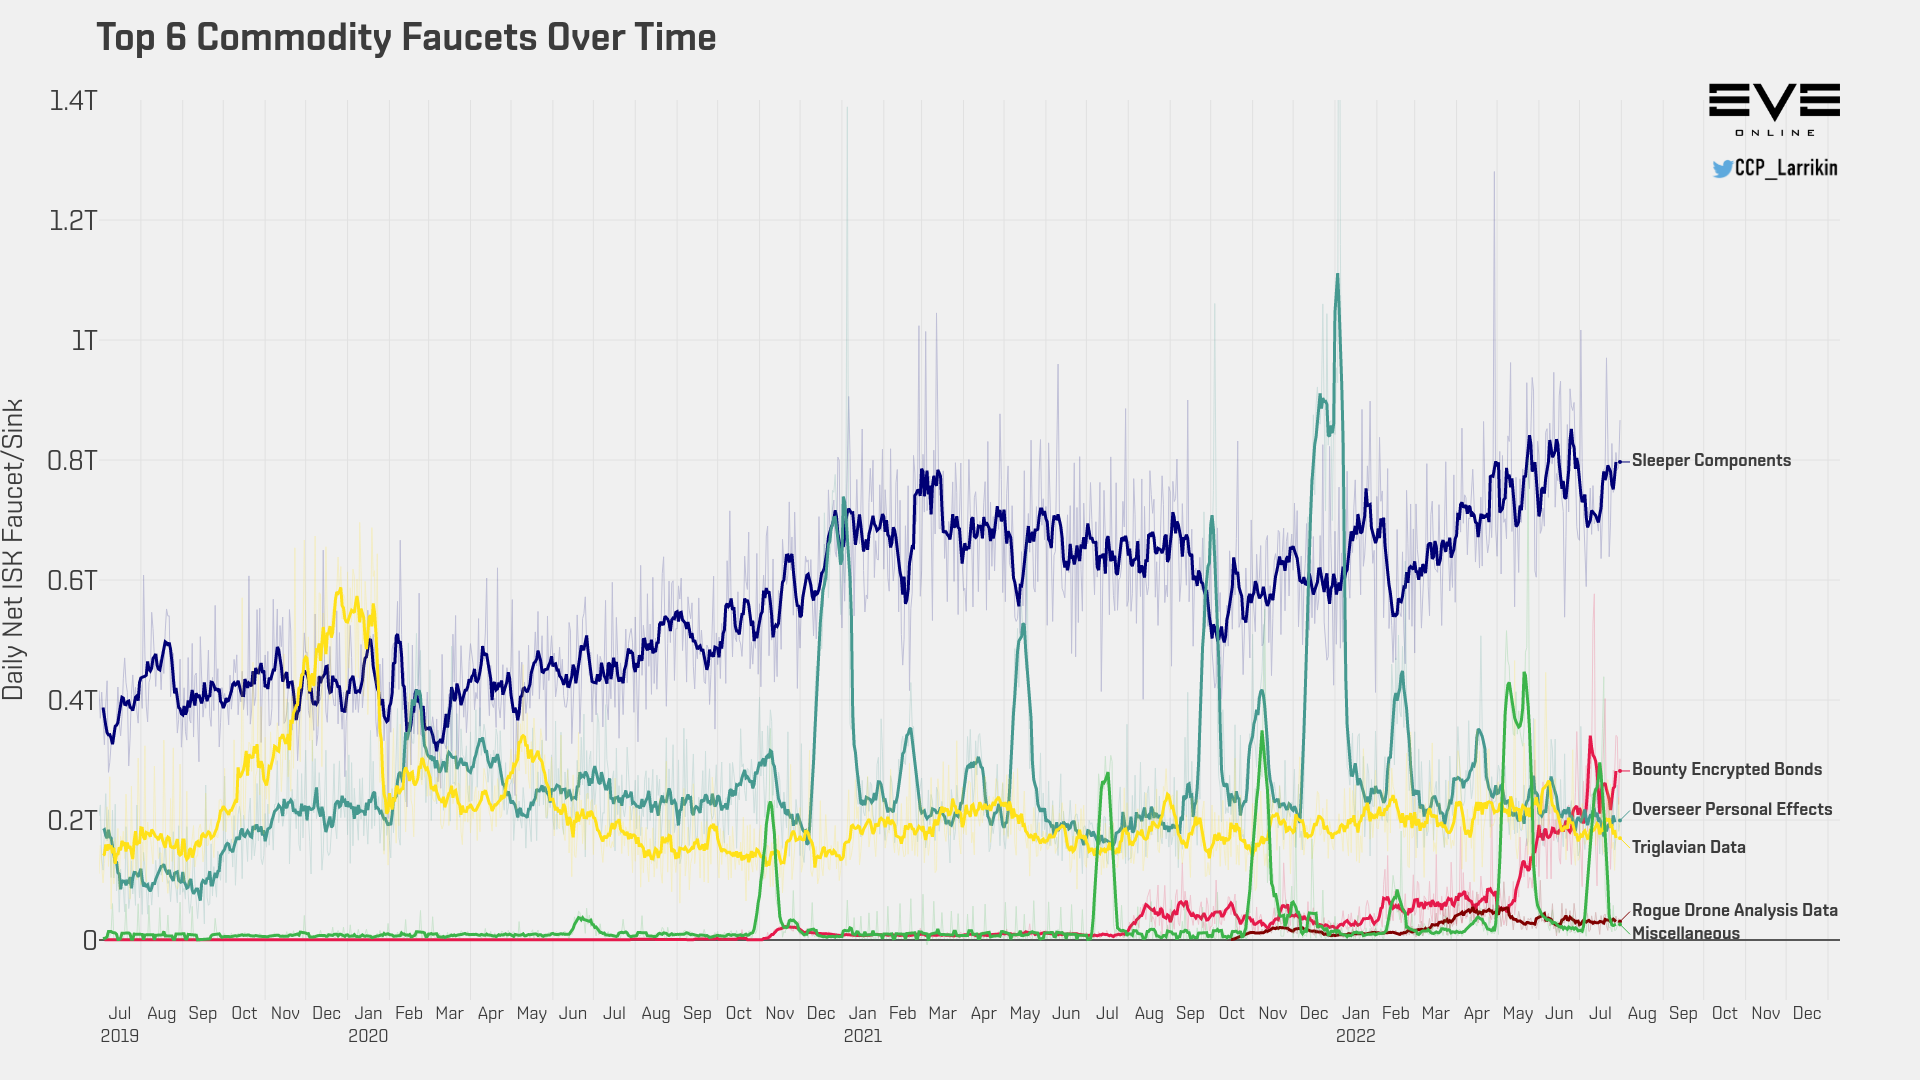
Sorry for the late reply - I’ll take a look at this and see what we can do, maybe we can have another random graph of the month in the January MER ![]()
Hey Arrendis,
Sorry for the late reply - I’ll take a look at this and see what we can do, maybe we can have another random graph of the month in the January MER ![]()
Hey Gozer,
I think this could be a useful addition to the MER data dump, a description of the files in the data dump. Will add this to the MER todo list!
But for the ones that you asked about, here is a short description of those:
price_change: The monthly price change of the sub index.
total_value: This months total trade value (volume*price) of the sub index.
price_change_weighted: The monthly price change of the sub index weighted by the trade value of indices within the main index.
entry_sink_value and entry_faucet_value: Are just the actual values, no rounding/flooring/ceiling. In the simplest terms, this is calculated by aggregating transactions between players and NPCs. Transactions from players to NPC is a sink, NPC to players is a faucet.
Hey Gustav Mannfred,
The figure you posted is from the June MER. In the July figure
![]()
Hopefully we will have that sorted for the August MER.
Hi Zhalyd,
In the May MER, there will be a distinction between those two for the reserve bank graph ![]()