On April 11th, 2018, we experienced an extended outage coinciding with the release of Fortnite 3.5. The outage blocked all logins for all players to our platform. We know many millions of you were excited about dropping from the Battle Bus with your friends, and it was a long time to wait to check out our 3.5 release. We sincerely apologize for the downtime.
We’re sharing more technical details in this post to give you a better understanding about what went wrong, what we did to fix it, and how we can prevent future issues like this from happening again.
Overview
At a high level, the Mongo database that backs our account service experienced severe performance degradation, which in turn caused our account service to be unavailable from April 11th 20:44 UTC to April 12th 14:30 UTC. This means all login requests, account creations, and queries for account information failed. With no way to query account information, there was no way to validate logins and accounts or process login requests.
At the first sign of major impact (20:44 UTC), multiple engineers began to investigate the issue. Over the course of the next 22 hours, we attempted to bring services back online 7 different times. This outage left a deep scar on service availability:

Over the course of the incident we found that call patterns caused cache pressure, connection storms knocked database members offline, node performance issues made things worse, and certain calls reading from primary were all contributing factors leading up to and extending our outage period. We made many different changes to try and restore the account service and this covers the main issues and changes we made.
Call Pattern Changes in Fortnite 3.5 Causing DB Cache Pressure
We had several call pattern changes in Fortnite 3.5 that slowly, over time, impacted database cache utilization. Deep investigation into Mongo logs and support from the Mongo database teams helped us uncover this. However, it took us many hours to reach this conclusion. A specific change in a call pattern caused us to reach new cache limits and cache evictions, which resulted in increased I/O to the point of performance degradation. This also uncovered a misreporting of I/O metrics in our database monitoring. We are correcting this and it is covered in the “What’s Next” section below.
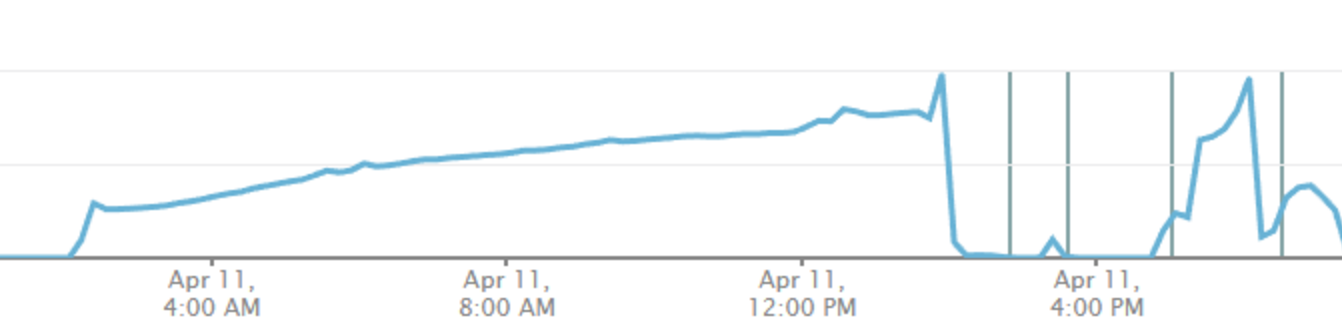
Figure 1. Unexpected excessive http calls to an API in question after client release. This aligns with the pattern in the graph in Figure 2 below.
We didn’t detect this immediately after release due to it being a slow multi-hour increase on a less-trafficked API. With so much going on in our databases, such as members going offline as noted below, identifying this as a culprit took a significant amount of investigation.
Over the span of several hours, we experienced an increase in cache reads from disk into memory. This indicated the dataset was larger than what fit into RAM and required having to move data in and out, as indicated by the below chart for a replset (MongoDB replica set) secondary (following the leftmost brown line).

Figure 2: The above chart shows cache pressure on the cluster primary following deployment of v3.5, and also going into service instability. Vertical lines represent instance restarts and leadership changes. The blue line trends up as cache read pressure increases, until the instance can no longer keep up with both request and replication load. The green line shows writes to disk, which also contributed to I/O issues.
Upon taking a closer look at cache behavior, we saw a sudden steep increase in the rate at which dirty cache was being accumulated (as seen in Figure 2). This was caused by heavy mutations and reads to the dataset, and, at our tipping point, I/O increased to a point of saturation.
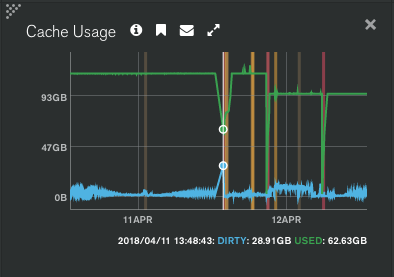
Figure 3: The above chart (times in PST) shows steady dirty cache (data written to RAM yet to be written to disk) on the cluster primary during the initial event. This is a clear indicator that DB mutations were occuring at such a rate that exceeded server capacity. At approximately 29GB of unsaved data, the mongod begins to have communication issues with the rest of the cluster.
We found that this cache pressure was sufficient to overload the current standing primary of our replica set, triggering leader elections.
We gathered logs and metrics and provided them to MongoDB Support for analysis. Their investigation started with what occurred in the hours leading up to our main availability issues. They were able to confirm that our last Fortnite release dramatically changed the cache behavior, with page eviction occuring much more frequently due to increased reads into cache. This continued to progress until the cluster could no longer support the load, at which time it started to take longer to process queries, causing the client application to surge in creating TCP connections.
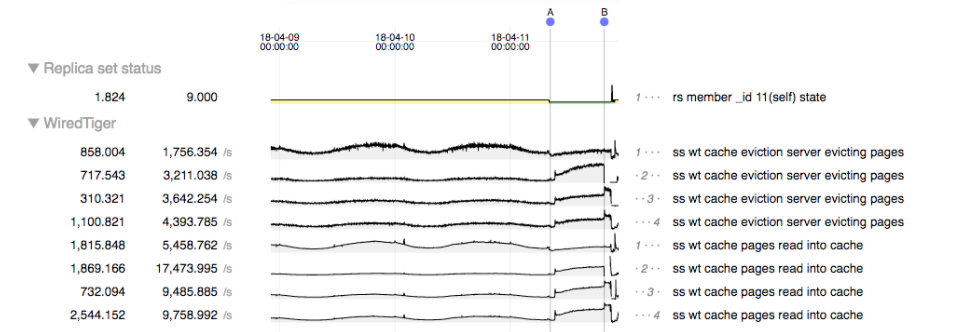
Figure 4: MongoDB’s Professional Services team provided the above chart of our cluster’s issues between application deployment (A), and the DB beginning to have availability issues (B). This chart also shows the increase in cache pressure, in particular the number of evicted pages on the primary server increases to 4.5x baseline before issues start.
From this point onward, our efforts turned to applying our lessons learned from partnering with several groups within MongoDB, primarily the Professional Services and Technical Services teams. Since the launch of Fortnite we have learned and applied many best practices and performance improvements in order to get the best scaling and availability characteristics out of MongoDB; our growth required it!
Connection Storms
Our short connection timeouts to Mongo resulted in rapid connection churn and when the database performance became degraded, the number of connections to the database from the application spiked rapidly. These spikes caused us to hit maximum configured connection limits. When maximum connections were reached, even intra-replset communication failed causing nodes to drop in and out of a healthy state. These connection storms caused a cascading failure across our Mongo replica set.
We bumped socketTimeoutMS up to 30 sec from 200 ms to help mitigate connection thrashing on the DB side during issues. Previously, it was used as a primary timeout setting to mitigate slow query hiccups. On average majority of our lookup queries are handled under 10ms.
We also started passing ‘maxTimeMS = 500ms’ with queries as a new query timeout setting. Rather than preemptively closing the connection after 200 ms, the database will terminate the operation after the maxTimeMS interval, keeping the connection open helping to mitigate connection storms during performance issues such as these.
We also moved to use mongos (MongoDB Shard Router), which has more connection controls for accessing to the mongod (primary daemon process for the MongoDB system) than the DB driver, to try and improve our Mongo connection handling.
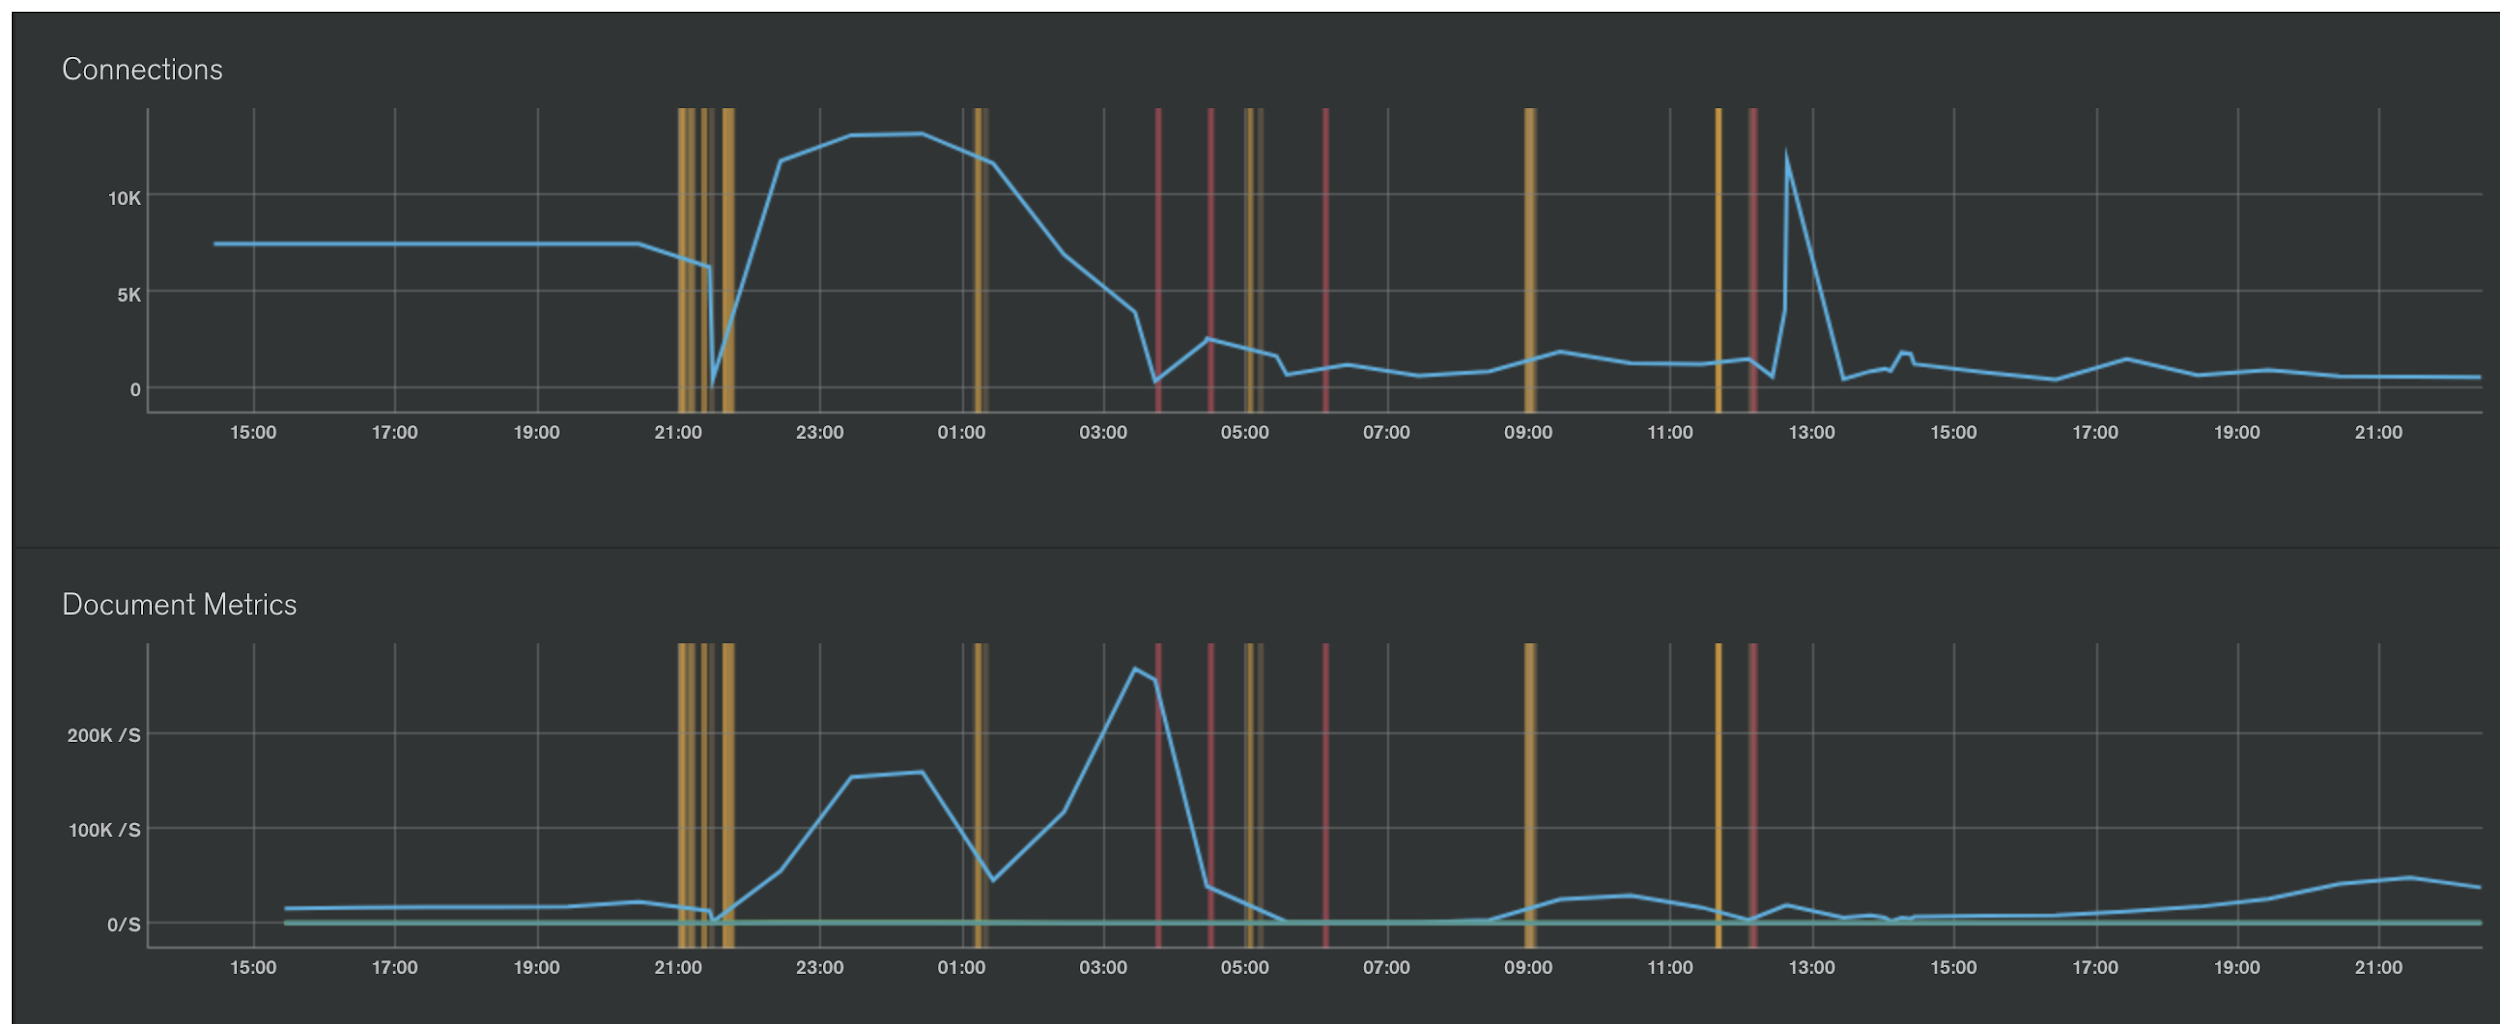
Figure 5: One of the replset member’s connection count and document movement rate during the event. Vertical lines represent instance restarts and leadership changes. At 02:48 UTC we switched to using mongos instead of talking directly to mongod, causing a much lower connection count load on individual replset members. While this didn’t immediately clear impact, it did protect us from intra-replset communication disruption. As a result, this protected us at least from further DB member disruption by leadership thrashing.
One of those key recommendations was to test and deploy an additional setting to our mongos fleet: ShardingTaskExecutorPoolMaxConnecting. This acts as a throttle on opening new TCP connections between mongos and mongod, moderating connection storms. This feature, backported from MongoDB v3.6 to v3.4, changes mongos socket creation speed from completely unbounded to approximately 50 connections established at a time - possibly lower in the future. This means that when a client application talks to the MongoDB driver, requesting a new connection (from mongos to mongod, not client to mongos), that the mongos will hold onto that request and possibly stall for a time, waiting for the mongos to open a new TCP connection to a mongod. As soon as a TCP connection moves out of the “connecting” lifecycle phase (a few milliseconds usually), more space is made for further connections.
Replica Set Degradation
Our accounts replica set reached a severely unhealthy state. Due to the size of the database, syncing additional members, and creating additional backups, it took a significant amount of time which also delayed recovery. Hitting the connection limits caused node after node to drop offline, each of which had to be brought back to a healthy state. Each attempt to recover would cause multiple members of the replica set to go offline. We removed traffic in these cases to allow for recovery and incrementally added clients back to full operation to restore the service.
Performance Issues on a Subset of DB Nodes
We had 2 specific members of our replica set that seemed to experience more severe performance degradation than others. In several cases CPU on these nodes instantly hit 100% utilization with 99% spent in system/kernel time. When this occurred, logging stopped, and the Mongo process itself appeared completely hung. With no logging or ability to debug the system, we were left with an unknown root cause.
Removing the two problematic members from the replica set did not resolve the issue, but these two nodes’ performance issues resulted in considerably lower capacity for our database. We have since isolated these nodes, replacing them with new members in the replica set.
We also moved to MongoDB v3.4 for our accounts database to try and take advantage of many of its performance improvements. While this wasn’t specific to the two nodes mentioned here, performance and resiliency improvements in v3.4 enabled us to use several new tuning parameters such as ShardingTaskExecutorPoolMaxConnecting mentioned above.
Specific API Calls Reading From Primary
We discovered a code path that had not been changed for some time that was pinning specific queries to the primary node. This put more pressure on the primary than was needed and didn’t allow these specific calls to scale out with our replica set members. We made code changes during the outage to have these reads come from secondary members allowing us to share the workload across the replica set.
All of the above changes, along with other specific tunings, allowed us to increase performance to the point of recovery and mitigate the circumstances that had resulted in cascading failures with our data store. We used several techniques to reduce call counts in our account service over this period and incrementally added traffic back to the service from a “cold start”.
Improvements implemented since outage
DB performance issues helped us discover a number of inefficiencies in data access patterns and updates. Over the last couple of weeks we’ve implemented a number of additional stability and resiliency improvements.
The Friend Suggestions feature on consoles had some scalability issues introduced in Fortnite 3.5:
- Requerying the list of suggested friends whenever a friends list refresh was triggered. The original intent was for this to only happen once on login.
- This was causing too many requests to the Account Service which increased API load by 300x on a specific API call.
- Normally we are able to dynamically adjust features via hotfixes, but in this case our tunables for this were broken.
Fortnite 3.5.1 introduced a fix to make sure the hotfix values were respected again and also made sure that we only refresh the list on login.
We’ve significantly reduced the amount of DB update calls by moving ephemeral data (like short-living single-use OAuth 2.0 authorization codes) out of MongoDB to ephemeral storage, Redis in our case. This let us noticeably reduce I/O load and reduce transaction log growth rates.
We’ve also improved caching of account data in a way that lets us reduce the amount of DB lookup queries at least by factor of 2x. Our longer-term goal though is to put the entire set of active users into a cache, so that even with DB in a degraded state actual impact would be much lower.
Yet another significant change we made was around the Fortnite client login sequence. Before our improvements, Fortnite would reset the login sequence even if it failed well beyond the sign-in step. Now it tries its best to resume where possible, saving work.
What’s Next?
Correct our I/O monitoring
While we did have I/O monitoring enabling, it turned out that our metrics were not an accurate measure of IOPS. We are in the process of increasing resolution on I/O reporting and monitoring from 5 minute to 10 second metrics. This will allow us to characterize disk problems in our fleet better and faster.
Put in alarming on early indicators of DB cache exhaustion
With the data from this event we are investigating appropriate early warning signs to alarm on cache pressure. This is not simple to get right with our existing tooling and we’re discussing internally and with MongoDB on best practices to alert us when we reach dangerous thresholds. Given different workloads and node types further analysis and load testing is required.
Improve the speed of adding and replacing replica sets nodes
One of the reasons recovery took longer than it might have was considerable amount of time it took to introduce new replica set nodes to replace unhealthy ones. We’re planning to evaluate options to improve this.
Continue with optimizing DB access patterns
We’ve identified a number of other improvements that would let us reduce load on the DB even further. One idea we are exploring is changing how we sync 3rd party information which typically doesn’t change at each login interval. When you login to our Epic platform using 3rd party information we update our DB and we sync your display name you use in the game so that we can show it to other players. Finding a balance on the optimal syncing strategy, along with other opportunities to optimize DB access patterns is something we will continue to explore.
Data set sharding
Sharding data is a natural way of increasing overall service capacity by splitting data into well-isolated pieces and assigning tasks to dedicated processing resources hosting those pieces. Sharding is most effective if you know in advance the shard to route your request to. Otherwise request needs to be handled by all shards in a cluster before you can get result. This is still better though than being capped with a single replica set.
MongoDB uses shard keys to distribute data across shards. Every account document has a natural primary key, which would be an ideal candidate for the role of sharding key. But we need to stay effective in looking account entries up by secondary keys, such as display name or email address. We’re working with the MongoDB team on defining an optimal data sharding strategy for our case.
Document a cold start process for account service
We successfully completed a cold start process for accounts, but there are a few items we learned along the way. Developing a runbook to test our cold start process during high traffic periods can improve our recovery time.
Improve our analysis of API calls per release
While this has been an ongoing effort here at Epic, we need to continue to improve our call pattern analysis testing and its impact on performance.
Continue working with the MongoDB team on database performance and reliability
We have implemented our best practices learned here and from previous events with support from the MongoDB team(s). We will continue to investigate performance and resiliency tunings for our databases. Our work does not stop here with this event.
We hope this postmortem has provided transparency into the issues that lead to our extended outage and recovery. While our constant goal is to avoid these scenarios, our learnings from this incident has lead to a considerable amount of changes and improvements across Fortnite and its services.
Interested in these sort of problems or think you can help us build the most reliable game services on the planet? Passionate about gaming and game services? Join Epic in Seattle, North Carolina, Shanghai, Salt Lake City, San Francisco, UK, Stockholm, Seoul, or elsewhere! Please shoot us an email at [email protected].